Financial Reporting and Business Analytics: Data-Driven Decisions for Tour Operators with TourSyncer

Published on 2026-07-12T20:42:03.968Z • 21 min read
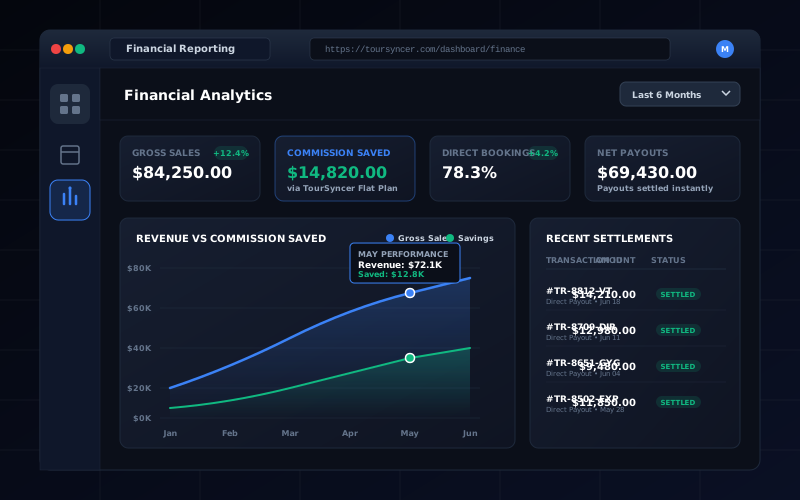
TourSyncer financial reporting and business analytics dashboard showing revenue metrics, profitability analysis, KPI tracking, and data visualization for tour operators

The Data Challenge: Making Sense of Financial Information

Tour operators generate vast amounts of financial data from bookings, payments, expenses, and operations. Without proper reporting and analytics tools, this data remains untapped, preventing informed decision-making and strategic planning. Manual financial tracking is time-consuming, error-prone, and provides limited insights. TourSyncer's comprehensive financial reporting and analytics platform transforms raw data into actionable insights, enabling tour operators to understand their business performance, identify opportunities, and make data-driven decisions that drive growth.

Common Financial Reporting Challenges

  • Data Fragmentation: Financial information scattered across spreadsheets, booking systems, and payment processors
  • Manual Compilation: Hours spent manually gathering and compiling financial data for reporting
  • Limited Insights: Basic reports that show what happened but don't explain why or what to do next
  • Delayed Reporting: Financial reports available only after month-end, preventing timely decision-making

Comprehensive Revenue Tracking

TourSyncer provides detailed revenue tracking that captures every transaction, payment, and revenue stream. The system automatically categorizes revenue by tour, customer segment, booking channel, and time period, providing comprehensive visibility into your financial performance.

Revenue Reporting Features

Real-Time Revenue Dashboard

Monitor revenue in real-time with live dashboards that update automatically as bookings occur. View daily, weekly, monthly, and annual revenue at a glance, with trend indicators showing performance direction.

Revenue by Tour Analysis

Identify your most profitable tours and understand which experiences generate the highest revenue. Compare revenue performance across different tours to optimize your product mix.

Channel Performance Tracking

Analyze revenue by booking channel to understand which channels drive the most value. Compare website bookings, mobile app bookings, vendor bookings, and third-party integrations to optimize channel strategy.

Customer Segment Analysis

Track revenue by customer segment, including first-time customers, repeat customers, group bookings, and corporate clients. Understand which segments drive revenue and focus marketing efforts accordingly.

Profitability Analysis

Understanding revenue is only part of the picture—profitability analysis reveals which tours and operations actually generate profit. TourSyncer's profitability reporting accounts for variable costs, fixed costs, and overhead to provide accurate profit margins for each tour and business segment.

Cost Tracking

Track all costs associated with tours, including guide wages, transportation expenses, equipment costs, venue fees, and marketing expenses. Categorize costs for detailed analysis.

Margin Analysis

Calculate profit margins for each tour, identifying which experiences generate the highest returns. Compare margins across tours to optimize pricing and cost management.

Key Performance Indicators (KPIs)

TourSyncer tracks essential KPIs that provide insights into business health and performance. These metrics help identify trends, opportunities, and areas requiring attention.

Essential KPIs Tracked

  • Revenue Per Available Seat (RevPAS):Measure revenue efficiency by tracking how much revenue each available seat generates
  • Average Booking Value: Track average revenue per booking to understand customer spending patterns
  • Capacity Utilization Rate: Monitor how effectively you're filling available tour capacity
  • Customer Lifetime Value: Calculate the total value each customer brings over their relationship with your business
  • Booking Conversion Rate: Track the percentage of inquiries that convert to bookings
  • Cancellation Rate: Monitor cancellation patterns to identify issues and optimize policies
  • Repeat Customer Rate: Track the percentage of customers who book multiple times

Customizable Reports and Dashboards

Different stakeholders need different views of financial data. TourSyncer provides customizable reports and dashboards that can be tailored to specific needs, whether you're a business owner, accountant, or operations manager.

Executive Dashboards

High-level dashboards for business owners showing key metrics, trends, and performance summaries. Get a complete business overview at a glance.

Detailed Financial Reports

Comprehensive financial reports for accountants and financial analysis, including profit and loss statements, balance sheets, and cash flow reports.

Trend Analysis and Forecasting

Understanding past performance is valuable, but predicting future trends enables proactive decision-making. TourSyncer's analytics platform includes trend analysis and forecasting capabilities that help anticipate future performance and plan accordingly.

Forecasting Features

  • Revenue Forecasting: Predict future revenue based on historical patterns, seasonality, and booking trends
  • Demand Projections: Forecast booking demand to optimize scheduling and capacity planning
  • Seasonal Analysis: Identify seasonal patterns and adjust operations and pricing accordingly
  • Growth Projections: Estimate business growth based on current trends and planned initiatives
  • Scenario Planning: Model different business scenarios to understand potential outcomes

Results and Impact

Tour operators using TourSyncer's financial reporting and analytics platform report significant improvements in financial visibility and decision-making:

75%

Reduction in Reporting Time

28%

Improvement in Profit Margins

100%

Financial Data Accuracy