Tour Operator Analytics: KPIs to Check Weekly

Learn which tour operator KPIs to check weekly - revenue per departure, load factor, booking pace - and see them in TourSyncer without spreadsheets.
The Numbers Every Tour Operator Should Check Weekly (Without Building a Spreadsheet)
It is 9:40 on a Tuesday night. You are three browser tabs deep into a question your accountant asked this morning: does the sunset kayak tour actually make money? Tab one is a CSV export from the booking tool. Tab two is the invoicing app, which disagrees with tab one because two group bookings were invoiced under the organizer company name. Tab three is a spreadsheet called MASTER-REPORT-v7-FINAL, which was last accurate in March. You paste, you patch a broken VLOOKUP, you find a duplicate row and delete it, and forty minutes later you have a number you do not fully trust.
Meanwhile the question that actually matters for next season -- add a second sunset departure, or quietly kill the Tuesday afternoon slot -- is still a coin flip. Most tour operators run this way. Decisions bounce between two instruments: the bank balance and gut feel. The bank balance tells you whether you survived last month. Gut feel tells you which tour feels busy. Neither tells you which departure quietly loses money every single week.
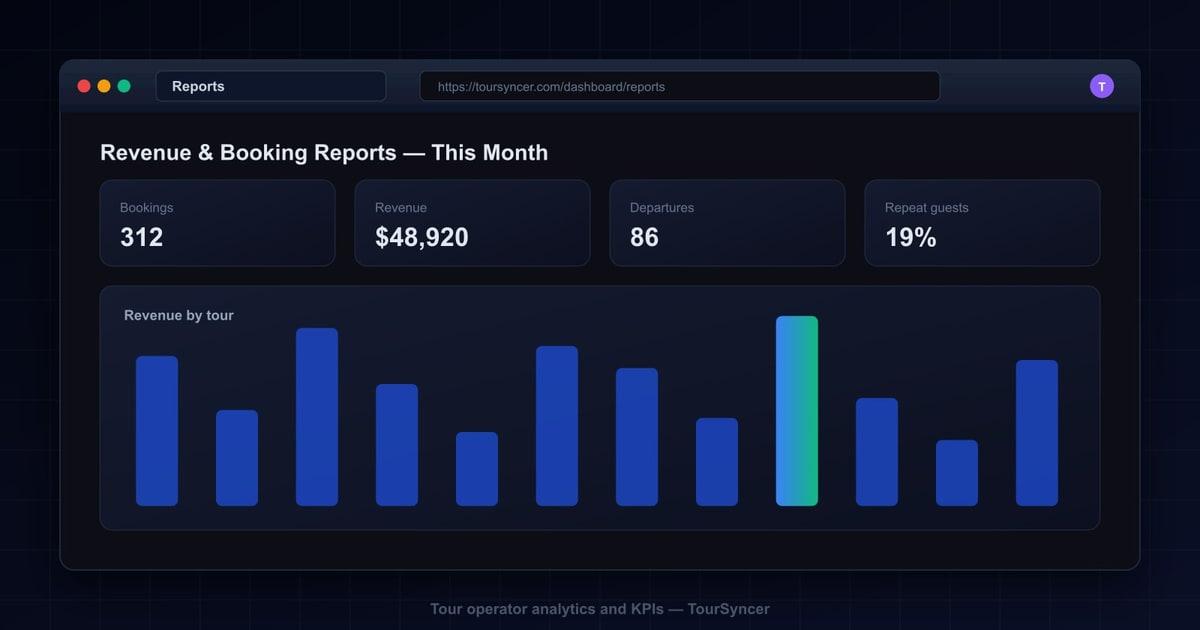
The short answer: a tour operator needs five weekly numbers -- revenue per departure, load factor, booking pace, cancellations and no-shows, and revenue by product -- and they should come from the system that already holds the bookings. TourSyncer is tour operator software that gives you in-product reporting on your booking and revenue performance without exporting to spreadsheets, so the report you read matches the bookings you actually took.
The rest of this guide covers what each number tells you, four decisions the numbers make easy, and why the fix is not another subscription.
Which KPIs Should a Tour Operator Actually Track?
You do not need thirty metrics and a wall of charts. You need a handful of numbers you will genuinely look at every week, each one attached to a decision you are willing to make.
-
Revenue per departure. Total takings for one run of one tour. This is the number that separates a tour that looks busy from a tour that earns its slot on the schedule. Compare it against what the departure costs to run: guide pay, fuel or transport, venue fees, equipment wear.
-
Load factor. Seats sold divided by capacity. A 15-seat walking tour that averages 6 guests is running at 40 percent -- fine if 6 guests clear your costs, a slow leak if they do not.
-
Booking pace. How far ahead of the departure date bookings arrive. Pace tells you whether next month is filling up on schedule, which is the difference between reacting to a slow August in August and reacting in June.
-
Cancellations and no-shows. Raw counts, plus the reason where you know it. A creeping cancellation rate on one product is an early warning that something upstream -- price, description, meeting point confusion -- needs attention.
-
Revenue by product. What each tour, transfer, or activity brought in over the period. This is the expansion-decision number and the marketing-budget number.
The math behind every one of these is primary-school arithmetic. The hard part has never been the math -- it is assembling the data. When bookings live in one tool, invoices in another, and walk-ups in a notebook, each number costs an evening. That is the real reason operators fly blind: not because the KPIs are complicated, but because the assembly is miserable.
Which Tour Should You Expand Next Season?
Every operator hits this decision eventually: one more boat, one more guide, one more daily slot -- but behind which product?
Before: gut feel and a shoebox of numbers. The booking tool shows one total. The invoicing app shows another, because group bookings and private charters were invoiced directly. A few corporate jobs live in an email thread. Faced with that assembly job, most owners default to expanding the tour they personally enjoy guiding, or the one that felt busiest in July. Feel is a rough proxy for load and a terrible proxy for revenue.
After: the booking and revenue records live in one place. When every booking -- online, phone, walk-up, group -- lands in one platform like TourSyncer, reporting on your bookings and revenue is part of the product, not a weekend project. Working out what each tour brought in starts from one set of records instead of three exports: take the figure, divide by the departures it ran, and set that against what a departure costs.
Here is a hypothetical to show the shape of the decision. Say the food tour brought in $38,000 across 60 departures last season and the boat tour brought in $52,000 across 110. The boat tour looks like the winner until you divide: $633 per departure against $473 -- and the boat also carries fuel, mooring, and a skipper. The bigger top line was hiding the weaker departure. That is a five-minute read when booking and revenue data sit in one system, and a shoebox archaeology project when they do not.
How Do You Spot Departures That Run Half-Empty?
Chronic under-filling is the quietest leak in a tour business, because no single day ever looks alarming.
Before: nobody notices the Tuesday 2pm. Each departure feels fine in isolation. Four guests show up, the tour runs, the guide gets paid, everyone goes home. No line item anywhere says the Tuesday 2pm loses money -- the loss is smeared across fifty slightly-bad Tuesdays a year. A spreadsheet could expose it, but nobody builds that spreadsheet until year end, if ever.
Run the arithmetic on a made-up example: a 15-seat walking tour averaging 4 guests at $30 takes $120 per departure. If the guide costs $90 and insurance, gear, and your own admin time eat most of the remainder, that slot is working for free -- fifty times a year.
After: the pattern sits in your booking data instead of a spreadsheet nobody builds. When every departure and its bookings live in one system, the light ones stop hiding. Checking last month against your break-even becomes part of a ten-minute weekly review instead of an annual dig. The practice is simple: flag any departure that closed below your break-even seat count three weeks running, then pick one of four moves -- reschedule it, merge it with a neighboring slot, price it differently, or cut it. Cutting is not the only answer; filling is often better, and dynamic pricing for tours covers when a cheaper off-peak seat beats an empty one.
How Do You Run a Monthly Revenue Review Without a Spreadsheet Marathon?
A monthly close should be a habit. For most operators it is a dreaded event.
Before: an evening of CSV exports and VLOOKUP repair. Export bookings from the booking tool. Export payments from the payment account. Open the invoicing app for the group jobs. Reconcile the refunds you issued that appear in one system but not the other. Fix the date column the export mangled. Discover the group booking that got counted twice. By the time the report exists it is three hours old, you are tired, and the acting-on-it part never happens. This is why so many operators quietly skip months.
After: minutes, in-product. Because the platform that took the bookings also issued the invoices, reporting on booking and revenue performance is already there -- nothing to assemble, nothing to reconcile, no drift between what the booking tool says and what the invoicing app says. The report cannot disagree with the invoices, because the report and the invoices come from the same records. The monthly review shrinks to: read the numbers, set them against last month, decide one thing. For what to look at once the assembly problem is gone, see our deeper guide to financial reporting and analytics for tour operators. And if invoicing is the messy half of your close, start with invoicing for tour operators.
How Do You Plan Around Seasonality With Records Instead of Memory?
Seasonal businesses make their biggest decisions -- hiring, maintenance windows, marketing spend -- months before the season starts. The quality of those decisions depends entirely on what you remember.
Before: memory and vibes. In February you plan the summer from what you remember of last summer. Memory compresses: July was crazy, September died early. It loses exactly the details that matter -- which week the pace actually picked up, which product carried the shoulder season, which departure time stopped selling once school restarted. So you staff a week late, schedule boat maintenance into what turns out to be a strong week, and repeat last year's mistakes with confidence.
After: this season goes on record, so next season starts from facts. The practice costs ten minutes a month: at each month end, note the actual numbers from your reporting -- what each product did, when pace moved, where cancellations spiked -- and keep those notes with your season plan. Next February, planning starts from last season's facts instead of last season's feelings. The habit only works if the records exist in one place, and that is the quiet advantage of running the season on one platform: the system that took every booking still holds every booking, instead of the history being scattered across a retired spreadsheet and an export you can no longer find.
What Does Flying Blind Actually Cost a Tour Business?
No invented industry statistics here -- just costs you can verify against your own calendar.
Hours. The monthly close that eats an evening. The quick question -- what did we do on transfers last quarter? -- that takes forty minutes of exporting to answer. Ten minutes here, an evening there; across a year it adds up to days of owner time spent being a manual data pipeline.
Errors. Two systems will always disagree eventually: a refund recorded in one but not the other, a rebooked group counted twice, a date column mangled in export. Every disagreement either costs time to reconcile or -- worse -- goes unnoticed, and you make a real decision on a wrong number.
Revenue leaks. The under-filled departure that runs for two years because nobody assembled the numbers that would have exposed it. The strongest tour that never gets the marketing budget because nobody knew it was the strongest. Prices held flat for three seasons because nobody had booking-pace evidence to justify a change.
Guest experience. Every evening spent repairing a spreadsheet is an evening not spent improving the tour, answering a guest, or training a guide. The duct-taped stack does not just cost money; it costs the attention your product is built on.
| Weekly question | Duct-taped stack | Reporting where the bookings live |
|---|---|---|
| Which tour makes money? | Export, reconcile, hope the columns line up | Booking and revenue reporting in the system that took the bookings |
| Which departures run light? | Nobody checks until year end | Part of a ten-minute weekly review |
| How did the month close? | An evening of CSV repair | Minutes, in-product |
| What did last season look like? | Memory and a retired spreadsheet | Booking history on record in one place |
Why a Reporting Add-On Just Creates the Next Silo
The tempting fix is one more subscription: a BI tool, a reporting add-on, a connector that pipes the booking tool into a dashboard. Sometimes that works. More often it recreates the original problem one layer up -- the dashboard becomes one more system that can disagree with the others. When the booking tool changes its export format, the connector breaks silently, and you are back to reconciling, now with an extra monthly bill and an extra login.
The problem was never a missing chart. The problem is that bookings, invoices, schedules, and check-ins live in different systems, so every question requires assembly before it can be answered.
TourSyncer takes the other route: one platform that runs booking management, guest check-in, invoicing and payments, staff scheduling, and reporting in a single subscription at one price -- see pricing for how that works. Reporting is not bolted onto somebody else's data. It reads from the same records the rest of the platform writes: the booking your guest made, the invoice you issued, the check-in your guide ran on tour morning. No exports, no connectors, no drift.
That consolidation is also why the numbers stay trustworthy. There is no version of the truth in the booking tool and a second version in the invoicing app, because there is no separate invoicing app. If you want to see everything that replaces the duct-taped stack, the full feature set walks through each piece.
Frequently Asked Questions
What KPIs should a tour operator check weekly?
Five numbers cover most decisions: revenue per departure, load factor (seats sold divided by capacity), booking pace (how far ahead guests book), cancellation and no-show counts, and revenue by product. Reviewed weekly, they show which tours earn their slot on the schedule, which departures run light, and whether next month is filling up on pace.
How do I find out which of my tours actually makes money?
Add up what each tour brings in per departure, then subtract what that departure costs to run: guide time, fuel or transport, venue fees, equipment wear. A tour with strong total revenue can still lose money per departure if it runs half-empty. The comparison only works when booking and revenue data for every product sits in one system instead of scattered files.
Do I need a BI tool or an analyst to get tour business analytics?
No. Most operator decisions -- which tour to expand, which departure to cut, whether this month beat last month -- need basic reporting on bookings and revenue, not a data warehouse. If your booking platform reports on the bookings it already holds, as TourSyncer does, you get the numbers without exports, connectors, or an extra subscription.
What is a good load factor for a tour departure?
There is no universal benchmark -- it depends on your capacity, costs, and price. The useful exercise is to work out your own break-even: the number of seats that covers guide pay and running costs for one departure. Any departure that regularly closes below that line is a candidate to reschedule, merge, or cut.
Does TourSyncer include reporting, or do I need a separate tool?
Reporting on your bookings and revenue is part of the platform, in the same place the bookings themselves live. There is no exporting to spreadsheets and no separate reporting subscription to buy. Because the reports read from the system that takes the bookings and issues the invoices, the numbers match what actually happened.
Check Your Numbers Where Your Bookings Live
If answering a basic revenue question currently requires an export, that is the thing to fix first. TourSyncer puts booking management, invoicing, scheduling, check-in, and reporting in one platform at one price -- or book a demo and bring your hardest reporting question with you.